Modeling and Optimization of Viral Loops [Part 3]
![Modeling and Optimization of Viral Loops [Part 3]](/content/images/size/w1200/2022/12/138.png)
Have you ever wondered how some products go viral while others don't? It's not magic; rather, it's a curated process. When done correctly, a viral marketing campaign can bring in hordes of new customers and skyrocket sales figures. However, many business owners fail to create successful viral loops, often because they don't understand how to model them.
In this blog post, let’s discuss the process of modeling viral loops and ways to optimize them. By understanding how viral loops work, you can create campaigns that are more likely to go viral and achieve your desired outcome.
Basics of a Viral Loop
A viral loop is a marketing term used to describe a process that encourages people to share content or products with their friends, in the hope of creating a "viral" effect. The aim is for the content or product to be so appealing that it spreads rapidly from person to person, generating a flood of traffic and sales.
A viral loop is the key to a successful online campaign. By understanding how a viral loop works and modeling it correctly, you can create a campaign that kick starts your growth. Increased brand awareness, more customers, and increased profits are just some of the benefits of viral loops.
Engineering Virality
Virality just doesn't happen. It is engineered by tons of minor optimizations necessitating product design, a great grasp of human behavior, and a growth-hacking mentality.
The first step is comprehending the four main drivers to understand the viral model:
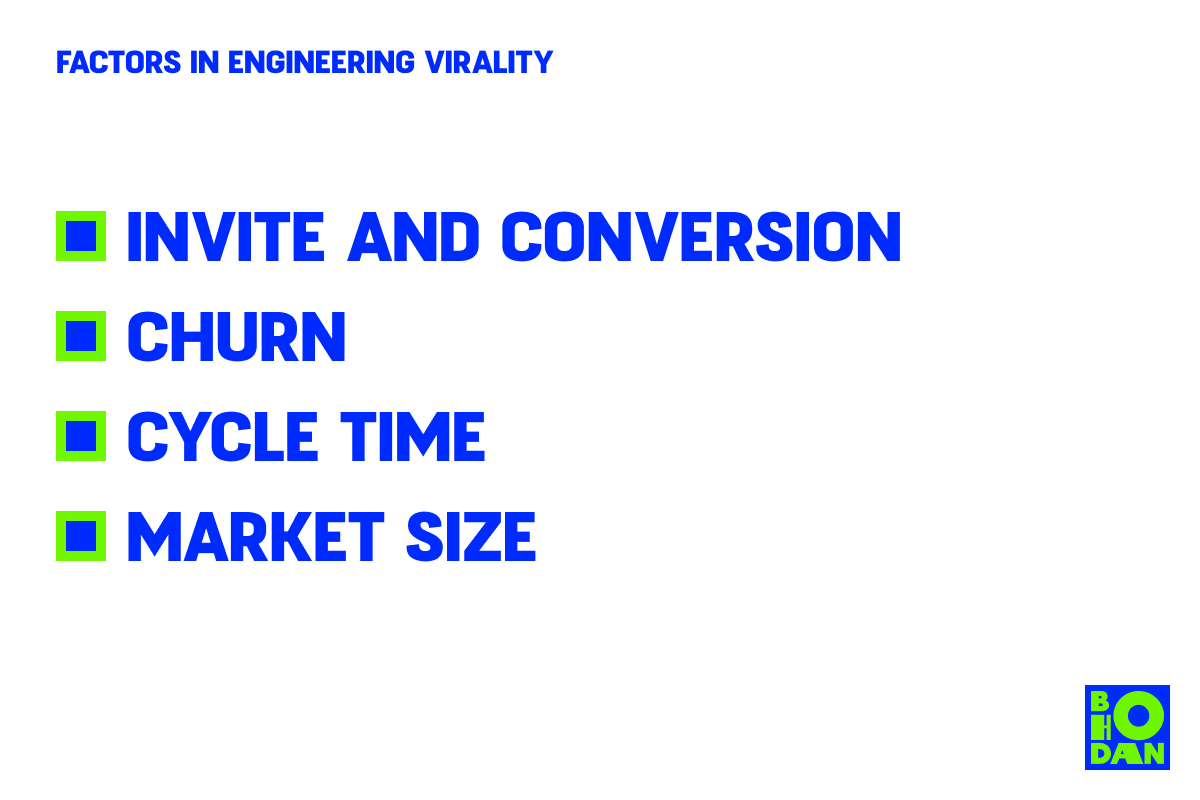
1. Invite and Conversion
Virality is often a numbers game. You need to have lots of people inviting their friends, and you need those friends to convert at a high rate. This is where the K-factor comes in.
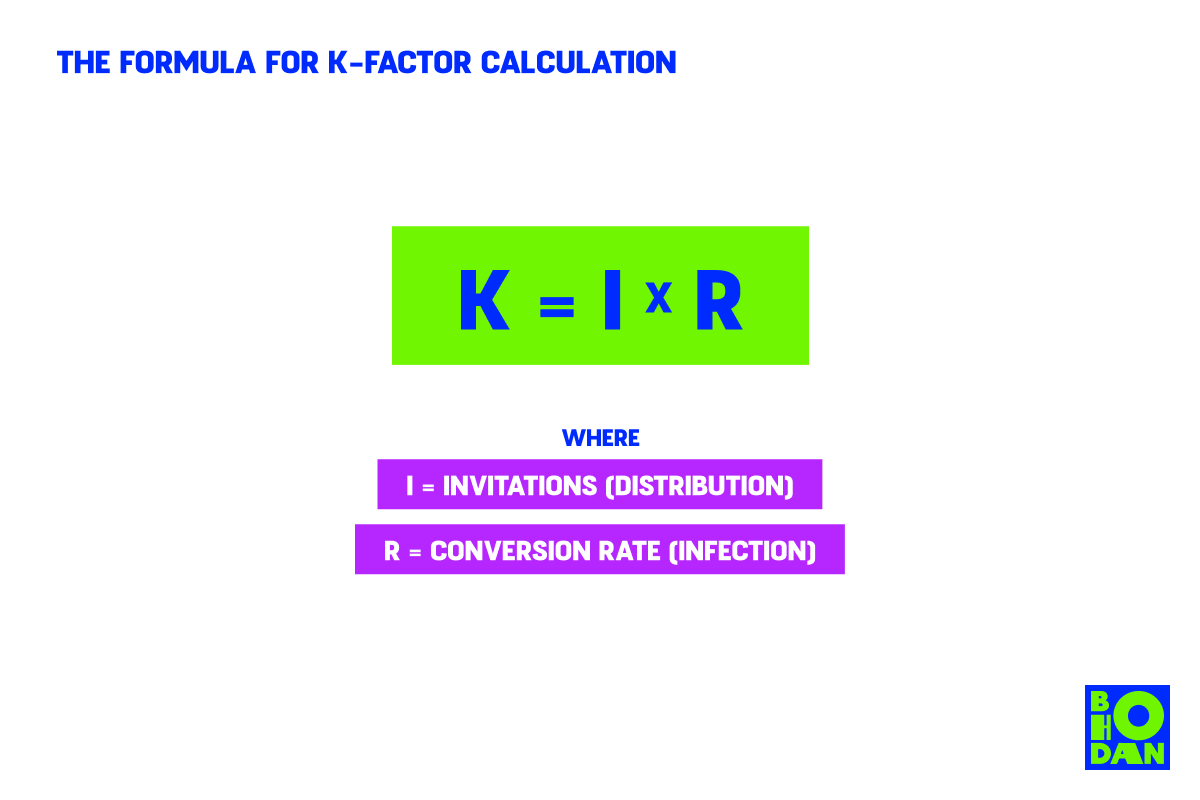
This formula is used to calculate how many users you'll get from a single person.
2. Cycle Time
The cycle time is the length of time it takes for an individual to go from first exposure to conversion. You want this to be as short as possible so users are more likely to experience your product and convert. To reduce the cycle time, you need to make sure you're reaching users early and often.
3. Churn
Churn is the rate at which users stop using your product. This can be due to a number of reasons, but you want to keep it as low as possible. The formula below tells you how long it will take for your product to go viral:
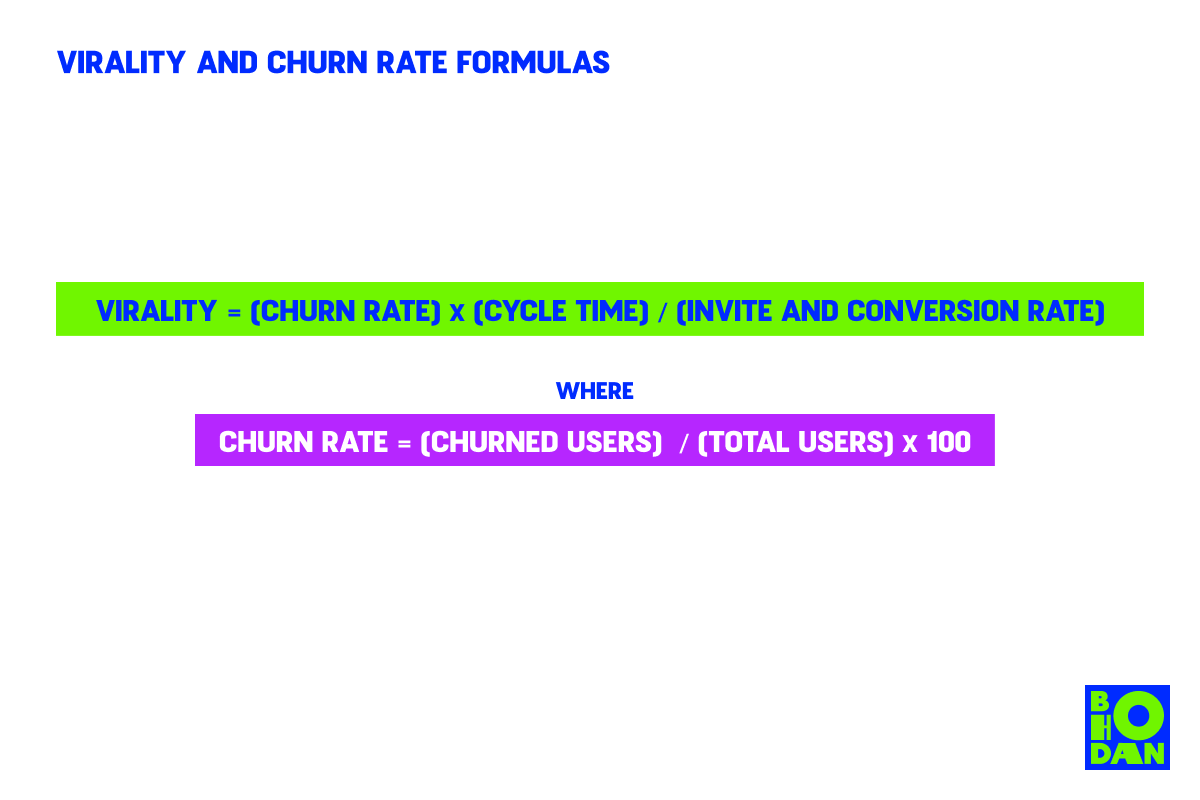
You can reduce the churn by keeping users engaged and using your product. You can also improve the invite and conversion rate by making it easier for people to use your product and by enticing them with rewards. Make sure you track all of these metrics so you can continue optimizing your viral loop.
4. Market Size
When it comes to going viral, the size of the market is important. If the market is too small, the chances of your product going viral are slim. You need to find a different market or a loophole that will offer access to a market large enough to support your growth goals.
You can also increase the chances of your product going viral by targeting multiple markets at once. This will help you reach more people and convert them at a higher rate.
What Goes into Modeling Viral Loops
There are a few key elements that come into play when modeling your viral loop, such as:
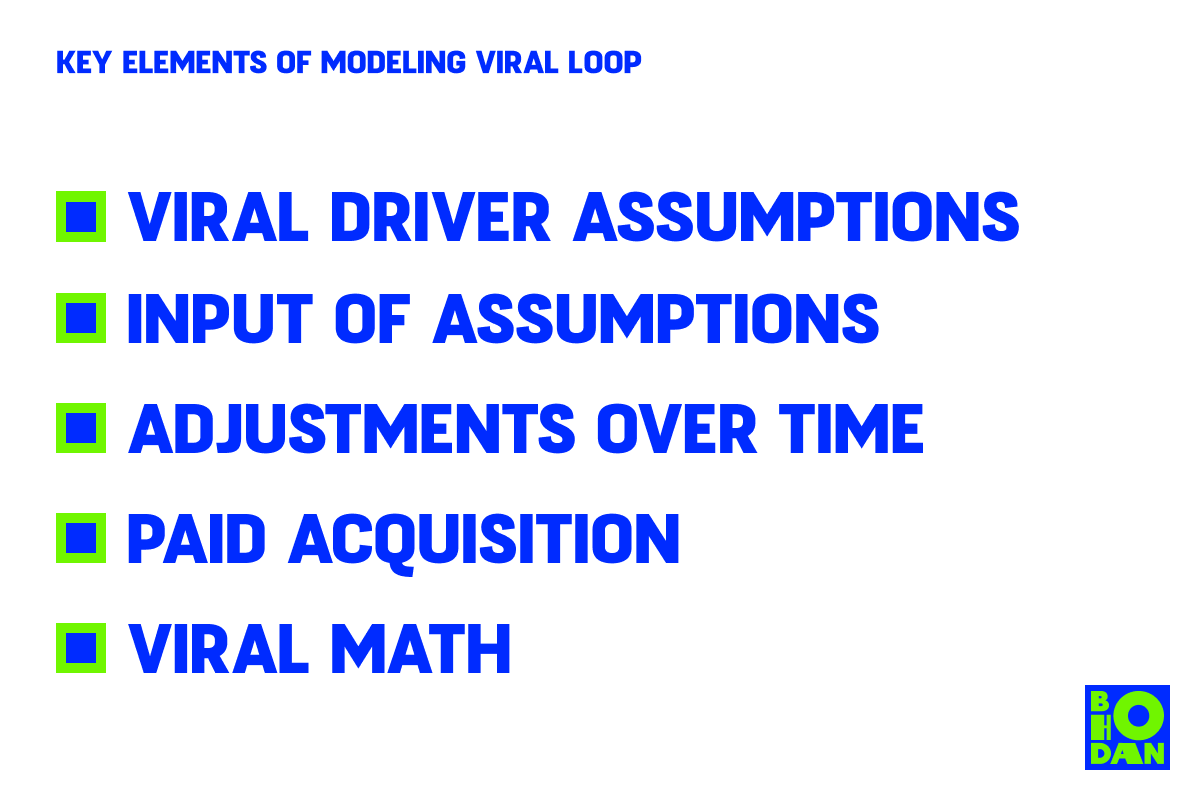
Viral Driver Assumptions
Let's say you have a base rate of 5, assuming a user sends out five referral invitations when onboarding. If this stays consistent for six months until the release of the next feature, the new feature will see the referral invites go up by 0.5. The rate increases to 5.5.
Let's look at another variable – you want a reduced viral cycle time. With three feature releases, the days will be reduced by half a day. There will be a negative 0.5 rate, and as a result, our cycle time is reduced to 7.5 days.
You'd also want the churn to diminish over time. In this case, you begin with 40% turnover and then reduce that by making it simpler to make new friends. As a result, the churn is reduced by 3% thanks to the new functionality.
Finally, we increase market size by moving into a new market where there are new potential users.
Paid Acquisition
The value of 100% growth from zero is still zero. You're going to need users from somewhere, and sometimes you'll have to pay for them.
The model's initial assumption is the users you actually obtain. Once you fill these in, the overall overview of users will be shown. This should result in a large number of free users, or perhaps a large number of users spread virally.
Input of the Viral Growth Assumptions
By using this model you get:
- 2000–3000 paying users per month from marketing efforts
- 5 invitations
- A cycle time that takes nine days to complete.
- 18% conversion rate on invitations
- A first-month churn rate of 40%
Viral Growth Math Overview
Formulas in this model include:
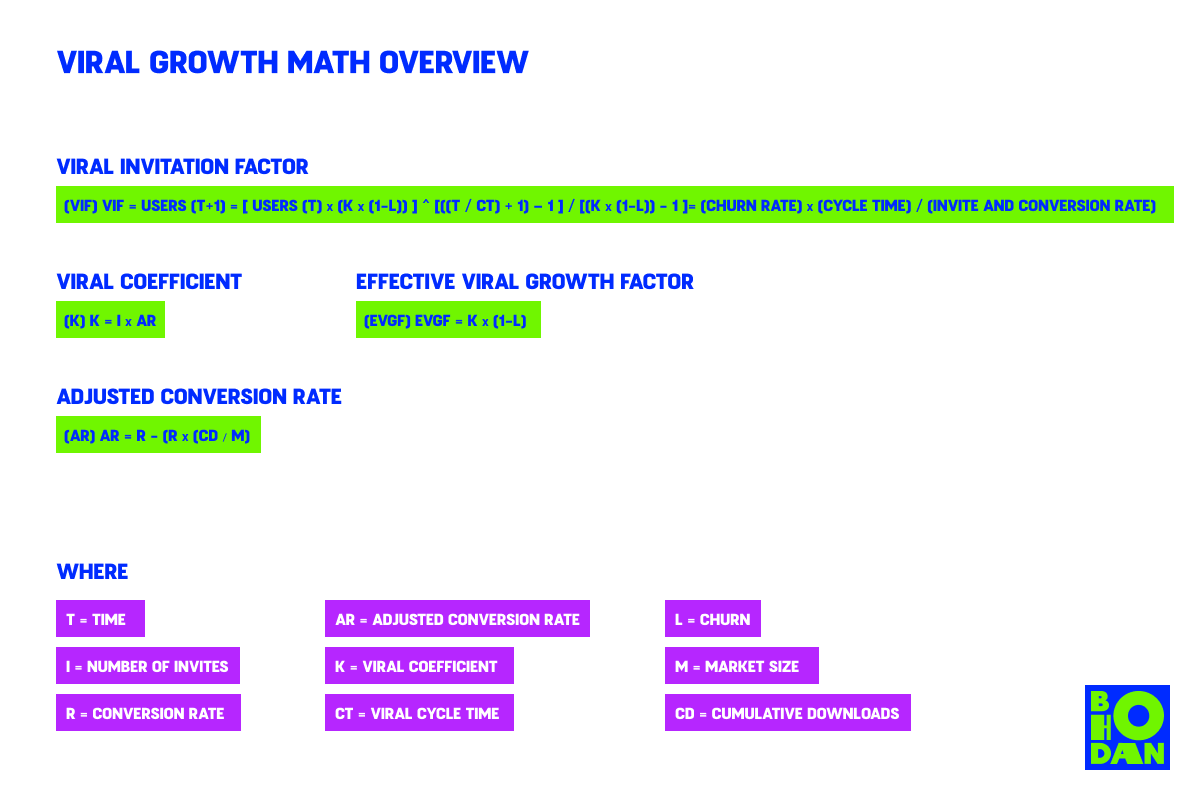
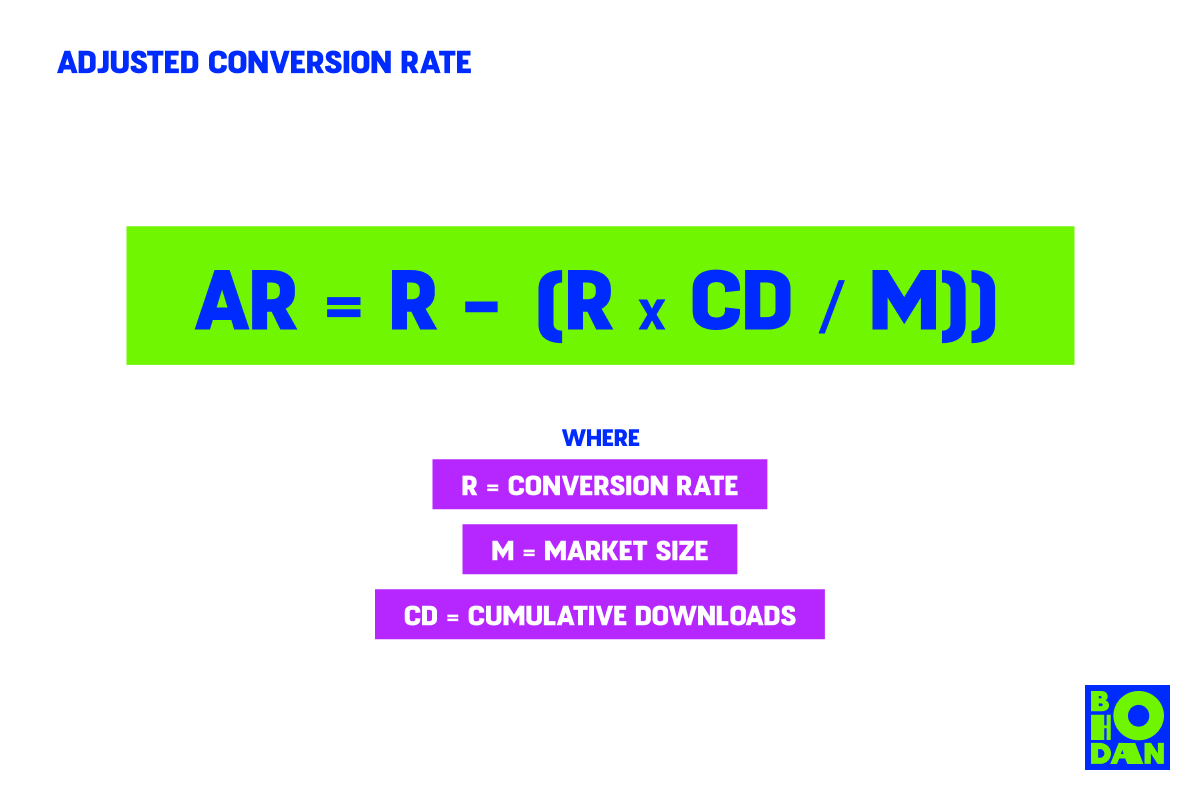
Adjusted Conversion Rate and Adjusted K-Factor
With a greater market share, we essentially make the conversion rate worse. As a result, when you reach 100% market penetration, the conversion rate (AR) is 100% garbage, i.e., ZERO. You cannot acquire any more users once you've exhausted the market.
At half the market share, the R of 18% is now reduced to 9%. That cuts your K-factor in half. See what's going on?
The market saturation point is a concept used to describe poorer AR. It rises to 4.6% in year three. As you enter the market, you will reduce your K correspondingly. If you have a large market with a low K (and are acquiring fewer customers), you will not notice this change.
This is the formula:
Want to read full article with ways to optimize viral loop? Subscribe to my blog (it's free) 👇
Ways to Optimize Your Viral Loop
One of the essentials in modeling a predictable viral loop is optimization, so let’s look at a few ways you can optimize the loop:
1. Make It Easy for Users to Refer You
It's one thing for users to be excited about your product and want to refer their friends, but it's another thing for them to be able to do so easily. Make sure you have clear referral instructions on your website and in your app. Check out this example, where you can send invitations while signing up for the product:

Make your sign-up process quick and easy, too — you want new users to join the loop in as few steps as possible. Also, provide value right away. New users should feel like they’re getting something necessary and helpful from using your product, even if they’re not yet referring others.
There are a number of good platforms to push your referral program:
- Email: It is still one of the most effective ways to reach your audience. You can include a referral link in your email signature or send an email blast to your list encouraging them to refer their friends. Use banners, images, and different types of text to grab their attention.
- Referral Landing Page: This is the page users are sent to when they click on your referral link. It should be attractive and easy to use, with clear instructions on how to refer to your product. It should also be relevant to the product you’re promoting so users know what to expect when they click through.
- Dedicated Referrer Page: If you have a particularly engaged user base, you may want to consider creating a page just for referrals. This page should have all the information users need to start referring their friends, as well as CTAs that drive them to your referral program.
2. Increase the Number of Contacts Users Have with the Invitation Form
Your invitation functionality should be promoted at the appropriate touchpoints. This will vary depending on your product and audience, but it could include your website, app, social media pages, email newsletters, and even physical advertising (if you have a brick-and-mortar business).
The customer journey is an important part of marketing, and you should always be thinking about how to reach your customers at the right time with the right message. Here is how referrals vary across the customer journey:
Purchase Stage. At the purchase stage, you want to focus on encouraging customers to refer their friends. You can do this by properly placing referral links to promote your campaign. Some places you can have the links include:
- Packaging or receipt
- Summary of purchase
- Confirmation page
- Confirmation email
- Post-purchase page
Retention Stage. The retention stage is the perfect time to remind customers about your referral program. You can do this by including a CTA on your website or app, as well as in email marketing campaigns. Have your referral links in these places:
- Dedicated referral page
- Marketing emails
- Milestone events
Advocacy Stage. The advocacy stage is the time to really encourage customers to refer their friends. You can do this by offering rewards and incentives for referrals, as well as providing feedback on how they’re doing. Some great ways to do this are through:
- Gift cards
- Branded gifts
- Thank-you cards
3. Gamify Your Referral Program
People love games, and they love winning rewards even more. Why not gamify your referral program to encourage users to act? You can do this by:
- Using a Point System. You can award points to users for every referral they make. These points can be redeemed for rewards, such as discounts, gift cards, or products.
- Progress Bars. A progress bar is a great way to show users how close they are to getting a reward. This can be used in conjunction with a point system or on its own. It’s a great way to keep users engaged and motivated.
- Show Rewards. Offering rewards is another great way to gamify your referral program. This could include anything from discounts to free products. Make sure the rewards are desirable and relevant to your product so users are motivated to refer their friends.
4. Consider How the Sharers and New Users Will Benefit
When someone refers a friend to your product, they’re doing you a favor. They’re introducing you to a new customer who may be interested in your goods. It’s important to consider how the sharer will benefit from doing that favor.
But it’s not just the sharer; you should also figure out why a new user should sign up. To understand the perspective of both, create hypotheses and test them out:
- Figure out the most unique feature of your referral program and what makes it attractive to customers.
- Determine the most-used feature of the referral program and why it’s popular. You can do this by surveying your customers or using analytics to see what actions they’re taking on your website or app.
- You can also directly ask the customer why they referred their friend. This can be done through surveys or interviews. Use this information to design a referral program that’s beneficial for both the sharer and the company.
5. Choose the Appropriate Incentives
Incentives are a great way to motivate people. However, you need to make sure they are appropriate and relevant to your product. If you’re offering a discount on a product the customer may not be interested in, they’re not going to be very motivated to refer their friends.
Here are some examples of great viral loop rewards:
- Free Products: If you’re a consumer-facing company, free products are always a great incentive. People love getting free stuff, and they’ll be more motivated to refer their friends if they know they could get a free product for doing so.
- Internal Currency: This is a type of currency that can only be used within your company. You can award this currency to customers for referrals, as well as other actions, such as signing up for a trial or buying a product.
- Discounts: Offering discounts is another great way to motivate people to refer their friends. This is especially true if the customer is already interested in your product. Offer two-sided rewards in discounts for both the referrer and the referee.
- Company Swag: Sending out branded swag is a great way to show your appreciation to customers who refer their friends. This could include anything from t-shirts and hats to tote bags and office supplies.
- Exclusive Content: If your company creates content, such as videos or articles, exclusive content can be a great incentive for referrals. This could include anything from early access to the video before it’s published to bonus footage or deleted scenes.
- Early Access: If your company offers early access to new products or features, this can be a great incentive for referrals. This is especially true if the product is still in development and not available to the general public.
- Access to Private Communities: If you have a private community for your customers, access to this community can be a great incentive for referrals. This creates a sense of inclusivity, which can be motivating for some people.
Optimizing a viral loop is trying to get even deeper into your audience's brains and find out what ignites them. Furthermore, it’s finding the right reward or incentive and making it easily achievable.
6. Increase Client Retention
Another way to get more people from virality is to increase retention. The more and longer a user is in touch with your product, the more likely they are to refer other users to it.
Customer retention is the percentage of people who continue using your product over a certain period. You can count the retention rate based on the following formula:
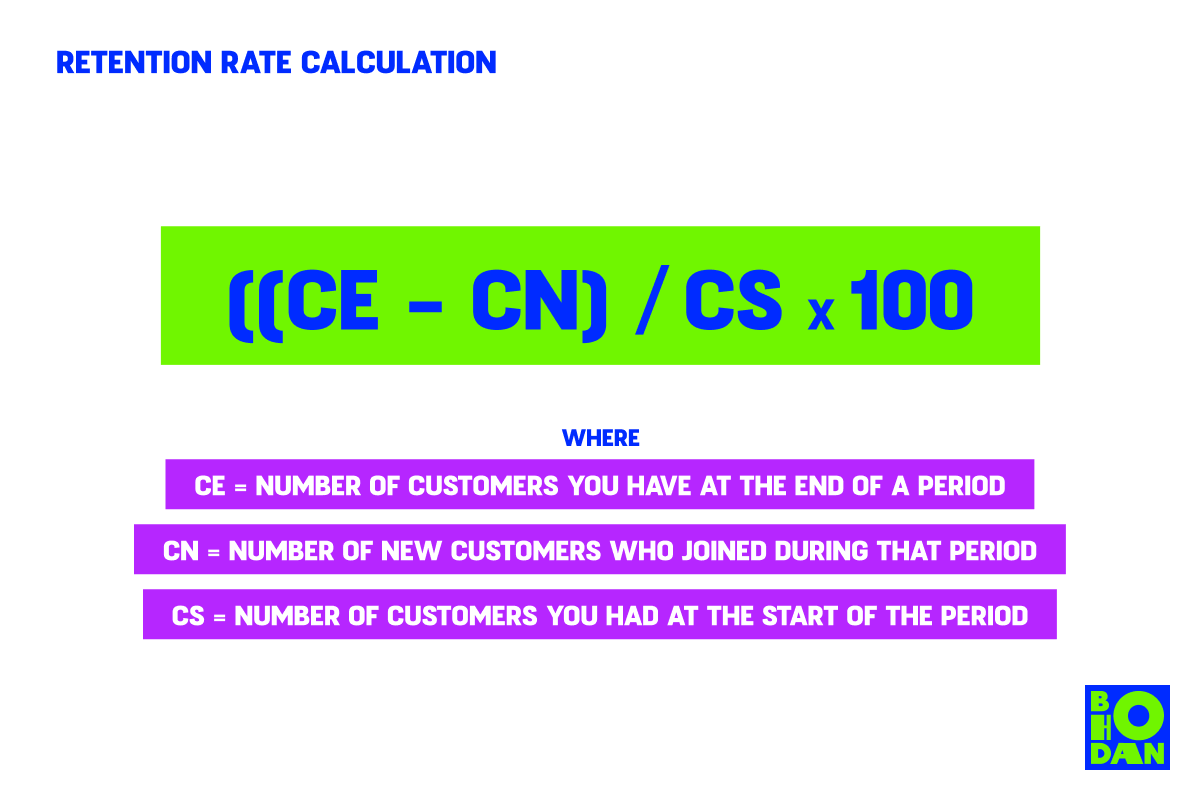
The percentage you get can be good or bad depending on your industry, but you can always increase it by:
- Improving your onboarding process. Customers are more likely to stick around if they understand the value your product gives and how to get it.
- Collect feedback as part of your loop. Find out what users like and dislike, along with what changes would motivate them to keep using your product.
- Reward loyal customers. Offer milestones that add even more value whilst using the product for a certain period.
Book a free 15-minute call with me
You'll get my view on your problem and ideas for solving it.
Conclusion
So, what can you do to make your campaigns go viral? The best way to ensure success is to model and optimize your viral loops. Create a successful model by taking into consideration factors like invites and conversion, churn rates, cycle time, and market size. You can then optimize your viral loops by testing different strategies to find what works best for you.
Keep in mind that virality is often unpredictable, so don’t be discouraged if your first few attempts don’t take off as you hoped. With a little perseverance and some experimentation, you should be able to create viral content that spreads like wildfire online.
Want to learn more about viral growth? Sign up to receive valuable marketing insights.